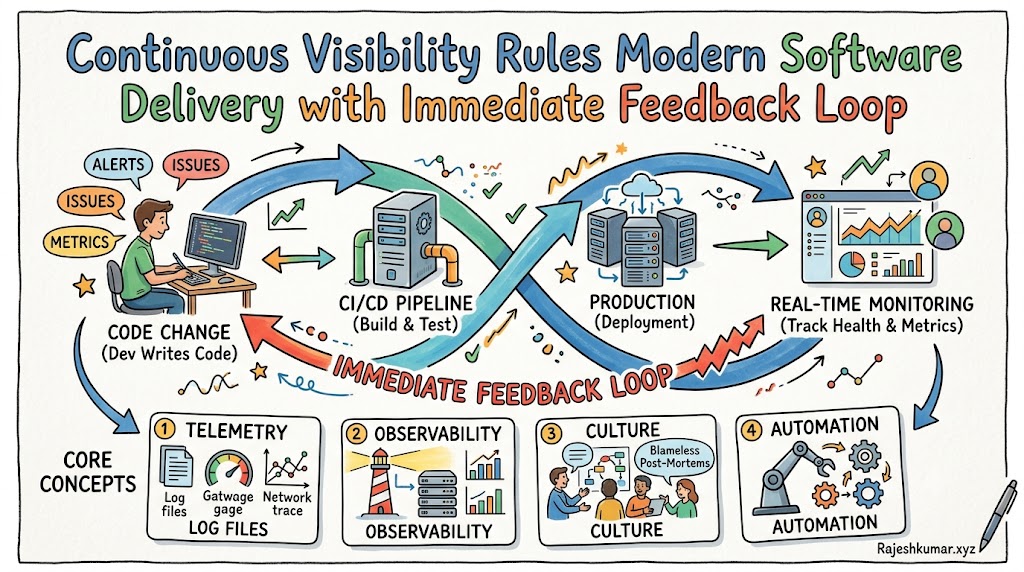
In the fast-paced realm of modern software development, teams often deploy code multiple times a day. Consequently, developers must understand how their changes behave in production immediately after deployment. A professional mentor like Rajeshkumar always emphasizes that waiting hours or days to discover an issue drastically increases remediation costs. Immediate feedback and continuous monitoring serve as the central nervous system of any successful deployment pipeline.
Therefore, engineering teams must build robust systems that track application health, infrastructure performance, and user experience metrics in real time. When you automate visibility across your pipelines, you eliminate blind spots and empower engineers to resolve issues before they impact end users. Monitoring is not merely an afterthought or a safety net; rather, it is a proactive strategy that drives engineering velocity.
Moreover, immediate feedback transforms how teams collaborate, shifting the focus from blame to rapid recovery. Instead of scrambling during outages, engineers rely on precise alerts that pinpoint root causes. Ultimately, embedding monitoring deep within your workflow ensures that your delivery processes remain stable, highly scalable, and exceptionally resilient against failures.
The Essential Role of Immediate Feedback and Monitoring in Modern DevOps
To truly appreciate the value of immediate feedback, we must first examine the traditional software delivery model. In older frameworks, testing occurred weeks after developers wrote the initial code. As a result, finding the root cause of a bug felt like searching for a needle in a haystack.
DevOps changes this completely by integrating telemetry into every single stage of the software lifecycle. Consequently, developers receive automated reports within minutes of pushing code to a repository. This rapid cycle drastically minimizes context switching, allowing engineers to fix bugs while the logic remains fresh in their minds.
Furthermore, continuous monitoring bridges the gap between staging environments and actual production behavior. Often, systems behave quite differently under real-world traffic than they do during isolated synthetic tests. Therefore, constant tracking provides live data on resource utilization, network latency, and application error rates.
When organizations prioritize these feedback loops, they experience a massive drop in their Mean Time to Repair (MTTR). Instead of guessing which deployment caused a sudden memory leak, automated dashboards instantly flag the exact commit responsible. This level of transparency builds immense confidence within engineering teams.
Ultimately, keeping a constant pulse on your infrastructure safeguards business revenue and customer trust. When a system monitors itself and alerts the right people instantly, downtime transforms from a catastrophic event into a minor, easily managed blip. It establishes a culture where data, rather than guesswork, guides every single operational decision.
Key Operational Concepts You Must Know
Understanding operations engineering requires a firm grasp of telemetry, which encompasses logs, metrics, and traces. Logs provide a time-stamped record of discrete events within your application. For example, a log entry might record a failed database connection or a successful user login event.
Metrics, on the other hand, represent numeric values measured over specific intervals of time. These include CPU utilization percentages, memory consumption, requests per second, and error counts. Metrics are excellent for triggering automated alerts because they allow you to set clear thresholds.
Traces complete the observability triad by tracking the journey of a single request across multiple microservices. When a user clicks a button, that request might travel through an API gateway, an authentication service, and a payment processor. Traces show exactly where delays occur.
[User Request] ➔ [API Gateway] ➔ [Auth Service] ➔ [Database]
                      └── Tracing tracks the entire journey ──┘
Code language: CSS (css)
Additionally, teams must master the four golden signals of monitoring: latency, traffic, errors, and saturation. Latency measures the time it takes to service a request successfully. Traffic quantifies the demand placed on your system, such as network throughput or concurrent active sessions.
Errors track the rate of requests that fail explicitly or implicitly. Finally, saturation measures how full your most constrained system resources are, such as disk space or memory pools. Monitoring these signals gives you a complete overview of systemic health.
Platform Implementation vs. Culture — What’s the Real Difference?
Many organizations mistakenly believe that purchasing expensive monitoring tools automatically grants them top-tier observability. However, platform implementation merely provides the mechanics, whereas culture dictates how engineers actually utilize those tools day to day. Setting up dashboards is easy, but building a culture that values data takes time.
An implementation-focused team often suffers from massive alert fatigue because they configure notifications for every minor metric spike. Consequently, engineers begin ignoring critical alerts, which eventually leads to unmanaged production outages. Tools alone cannot teach a team how to prioritize critical system events.
Conversely, a healthy operations culture fosters shared accountability across both development and operations teams. Developers actively write custom metrics into their code rather than leaving monitoring entirely to the infrastructure team. This collaborative approach ensures that visibility is designed directly into the product.
| Aspect | Platform Implementation | Engineering Culture |
|---|---|---|
| Primary Focus | Tool deployment, dashboard configuration, and infrastructure setup. | Shared ownership, psychological safety, and continuous learning. |
| Handling Failures | Creating automated tickets and executing rollback scripts. | Conducting blameless post-mortems to fix systemic issues. |
| Metric Ownership | Maintained solely by the central operations or platform team. | Managed collaboratively by developers and system engineers. |
Ultimately, tools are only as effective as the processes and mindsets supporting them. When you blend a solid platform implementation with a blameless, data-driven culture, engineering teams thrive. They view production failures as valuable learning opportunities rather than reasons to point fingers at individuals.
Real-World Use Cases of Modern Operations
Consider a global e-commerce platform experiencing a sudden, massive surge in traffic during a flash sale. Without immediate feedback loops, the underlying database might saturate quietly until the entire checkout service crashes completely. However, real-time monitoring alters this scenario entirely.
As traffic spikes, automated metrics detect a sharp rise in CPU utilization and database connection pool exhaustion. Instantly, the monitoring system triggers an auto-scaling event, spinning up additional container replicas to distribute the load. The engineering team monitors the smooth transition through live dashboards.
Another powerful use case involves a financial technology company deploying a new microservice via a canary deployment strategy. They route only 5% of live production traffic to the new version while closely monitoring error rates. Within minutes, the monitoring tool detects an anomaly.
                           ➔ [Canary Version: 5% Traffic] ➔ (Errors Detected! Auto-Rollback)
[Live Production Traffic]
                           ➔ [Stable Version: 95% Traffic] ➔ (Running Smoothly)
Code language: CSS (css)
Because the error rate on the canary instance exceeds the acceptable threshold, the deployment pipeline triggers an automated rollback. The remaining 95% of users never experience a single issue, and the system reverts to safety cleanly. This demonstrates how immediate feedback loops actively protect the user experience.
Common Mistakes in Operations Engineering
A very frequent mistake in operations engineering is configuring vague, non-actionable alerts that disturb engineers outside of working hours. For instance, receiving a high-priority page stating “CPU utilization is at 92%” offers zero context regarding what is actually failing. Alerts must always specify the impact.
Instead, alerts should focus on user-facing symptoms, such as “API checkout endpoint is returning 500 error codes to users.” This clear messaging helps the on-call engineer understand the urgency and immediate business impact. It prevents unnecessary panic across the wider organization.
Another critical error is collecting massive amounts of data without defining clear retention policies or analysis strategies. Teams often store terabytes of detailed application logs that nobody ever reads, which runs up massive cloud storage bills. You must align data collection with actionable business goals.
Furthermore, many teams neglect to update their dashboards as their application architecture evolves over time. A dashboard built for a monolithic application becomes entirely useless once the team migrates to distributed microservices. Monitoring infrastructure requires continuous refinement and regular maintenance.
Finally, relying exclusively on manual interventions to resolve well-known, repetitive system issues drains engineering resources. If a service always requires a manual restart whenever disk space reaches 90%, that process should be automated via a script. Operations engineers must always strive to eliminate repetitive toil.
How to Become an Operations Expert — Career Roadmap
To become a highly proficient operations expert, you must build a strong foundation in system fundamentals and software engineering. Start by mastering Linux internals, networking protocols, and basic scripting languages like Python or Bash. Understanding how operating systems manage processes is absolutely vital.
Next, focus your learning on containerization technologies and modern cloud infrastructure platforms. You need to understand how to orchestrate applications efficiently and manage infrastructure safely through code rather than manual clicks. Continuous integration pipelines will become your daily workspace.
- For Junior Engineers:
- Focus intensely on mastering basic Linux administration, shell scripting, and understanding fundamental core networking protocols.
- Learn how to read, interpret, and configure standard system logs and application metrics using open-source tools.
- Practice building simple, automated continuous integration pipelines that run basic linting and unit tests successfully.
- For Mid-Level Engineers:
- Dive deeply into container orchestration platforms and manage complex infrastructure strictly through automated code files.
- Design comprehensive alerting policies based around the four golden signals to reduce team alert fatigue significantly.
- Participate actively in on-call rotations and lead blameless post-mortem discussions after production incidents occur.
- For Senior Engineers:
- Architect highly resilient, multi-region deployment strategies that incorporate automated canary testing and rapid rollbacks.
- Align technical observability metrics directly with high-level business KPIs to show clear operational value.
- Mentor junior team members and design long-term platform engineering roadmaps that eliminate organizational operational silos.
As you advance, dedicate time to studying the core philosophy of site reliability engineering. Learn how to calculate error budgets and define meaningful objectives that keep development velocity balanced with system stability. True expertise comes from blending deep technical knowledge with empathetic team leadership.
FAQ Section
- What is the main difference between monitoring and observability in modern software systems?Monitoring focuses specifically on tracking pre-defined metrics and letting you know when a system component breaks down. Observability, conversely, allows you to infer the internal state of a highly complex system based entirely on its external outputs. Therefore, monitoring tells you when a system is failing, while observability helps you understand why it is failing deep within the architecture.
- How can engineering teams effectively minimize alert fatigue among their on-call staff?Teams can drastically reduce alert fatigue by ensuring that only urgent, actionable, and symptom-based events trigger immediate paging notifications. If an issue does not require immediate human intervention to prevent user impact, it should route to a ticketing system instead. Additionally, teams must regularly audit their alerting rules to remove noisy or obsolete thresholds that no longer serve a purpose.
- Why are tracing tools considered absolutely essential for microservices architectures?In a microservices architecture, a single user request often passes through dozens of independent, isolated network services before completing. Consequently, if a request suddenly slows down, pinpointing the exact bottleneck using traditional logs becomes nearly impossible. Tracing tools solve this by attaching a unique identifier to the request, mapping its entire journey across the network visually.
- What are the four golden signals of monitoring that every operations team must track?The four golden signals of monitoring are latency, traffic, errors, and saturation, which together provide a comprehensive view of system health. Latency tracks response times, traffic measures system demand, errors monitor failure rates, and saturation identifies resource constraints like memory or disk limits. Prioritizing these four core signals ensures that you cover the most critical vectors of potential system degradation.
- How does immediate feedback within a deployment pipeline improve overall developer productivity?Immediate feedback ensures that developers discover code defects within minutes of committing their work rather than days or weeks later. This rapid notification prevents costly context switching, allowing the engineer to resolve the issue while the logic is fresh. Ultimately, it accelerates delivery timelines, boosts developer confidence, and keeps production environments exceptionally stable over the long term.
Final Summary
Embracing immediate feedback loops and comprehensive monitoring is a non-negotiable requirement for any engineering team striving for high velocity and reliability. By establishing deep visibility across your delivery pipelines, you transform production environments from stressful black boxes into highly predictable, data-driven systems. This technical shift ultimately protects your business revenue while fostering an engineering culture rooted in continuous improvement.
Furthermore, true operational excellence requires balancing robust platform implementations with a healthy corporate culture that prioritizes psychological safety and blameless problem-solving. When developers and system operations engineers share equal accountability for system health, software quality improves organically. Tools provide the initial framework, but your team’s collective mindset determines your ultimate success.
As software architectures grow increasingly complex, relying on old, reactive workflows becomes a massive liability. Therefore, you must proactively invest in building highly observable systems that self-heal and communicate their health continuously in real time. Prioritizing these core modern operational principles ensures that your organization remains incredibly resilient, highly scalable, and fully prepared for any scale of future growth.


Leave a Reply
You must be logged in to post a comment.