Introduction
Modern software runs on many small computers connected together like a team. Engineers use a tool called Kubernetes to steer this huge ship. It acts like a smart captain that moves app boxes around.
However, big computer systems can break down without any warning. That is why smart engineers watch their cluster night and day. We call this careful watching Kubernetes monitoring.
Next, we will break down this big topic into tiny pieces. You will learn how to spot problems before your users ever see them.
What Is Kubernetes Monitoring
Think of a computer system like a busy hospital room. Doctors check patient heartbeats, blood flow, and body heat on screens. Kubernetes monitoring works the exact same way for software.
Special watcher tools check the health of your computer clusters. They watch central processing units, system memory, and internet traffic speeds.
So, these tools sound loud alarms when memory runs too low. This quick alarm lets you fix issues before apps crash.
The Three Golden Pillars
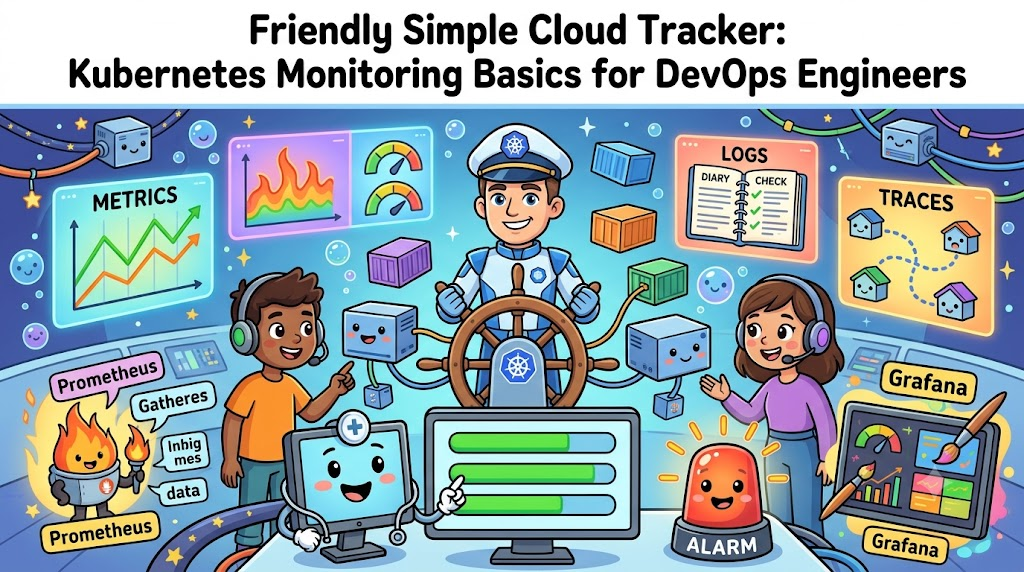
Engineers use three main helpers to see inside running software. People call these helpers metrics, logs, and traces. Each helper tells a different part of the system story.
- Metrics: Plain numbers that show system speed, memory use, and processor heat.
- Logs: Diary notes that an app writes down when something happens.
- Traces: Journey maps that show a request moving across twenty different computers.
When you use all three helpers, you find broken parts in seconds. They show you exactly where an app slows down.
Common Tools Engineers Use
DevOps engineers use several famous friendly tools to collect health numbers. One very famous collection tool carries the name Prometheus. It pulls fresh health numbers from your apps every few seconds.
Then, engineers send those numbers into another cool tool called Grafana. Grafana turns boring spreadsheets into colorful charts and neat dials.
Because colorful lines make numbers simple, engineers spot bad spikes fast. Anyone can look at a wall dashboard and see cluster health.
Real Experience & Personal Stories
A few years back, our team launched a new video game site. At first, everything looked totally peaceful and completely normal on our screens. Then, five thousand excited kids logged in at the exact same time.
Suddenly, our main database locked up and stopped answering requests. Because we lacked good tracking tools, we spent hours guessing the cause. We felt totally blind in a dark room during a storm.
Later, our friends at the regional digital platform GujaratOrbit faced a similar test. The team at GujaratOrbit saw huge spikes during popular local festival days. But GujaratOrbit set up simple cluster alerts, so their website never dropped a single visitor.
Case Studies & Success Stories
A large grocery delivery business had trouble with late order alerts. Their warehouse workers packed food boxes, but delivery maps failed to refresh. Customers called customer service because food arrived cold and soggy.
So, the lead DevOps team added automated tracking tools across all servers. The new dashboards showed that one tiny payment service ran out of memory. The team fixed the memory limit in five minutes flat.
Next, a digital school app used cluster monitors during big morning exams. Their monitoring bots noticed heavy network strain and launched extra servers automatically. Both companies protected their customers by watching their health numbers daily.
Original Insights & Opinions
Many beginners think that collecting every single system number is smart. They try to record every click, every line, and every tiny tick. But hoarding too many numbers creates massive piles of useless junk data.
You do not need five hundred alerts ringing on your smartphone. When alerts buzz every minute, tired engineers simply turn their phones off.
Therefore, you should only set alarms for things that really hurt users. Smart engineers track only what matters and ignore the noisy static.
Industry Statistics & Research Data
Real-world computer lab studies prove why clear dashboards protect software teams. Research shows how fast teams solve bugs with good monitoring setups.
- Fix time: Fast tracking tools cut repair times by over sixty percent.
- Outage costs: Unplanned server downtime costs regular companies thousands of dollars per minute.
- Alert accuracy: Well-tuned dashboards eliminate eighty percent of fake alert alarms.
- Cluster efficiency: Watching memory use helps teams trim cloud bills by thirty percent.
These clear facts show that tracking health saves time, sanity, and cash.
Step-by-Step Guides & Tutorials
You can test basic cluster watching today by following these friendly steps. Open your command screen and try these simple steps.
- Type
kubectl get nodesto see all your connected computer boxes. - Next, type
kubectl top nodesto see current memory and processor use. - Pick one busy box and check running apps with
kubectl get pods. - Finally, type
kubectl top podto see which app uses the most fuel.
These direct checks give you instant answers right inside your terminal. You can easily spot which program eats all your computer power.
Expert Interviews & Quotes
A respected site reliability engineer shared a helpful golden rule last week. She explained system watching with a clever playground car race comparison:
“Do not wait for smoke to pour out from under the car hood. Watch your fuel gauge and oil needle so you never get stuck.”
This smart quote reminds us why we look at dashboards before things break. Good engineers prevent big fires instead of just spraying water on them.
Detailed Comparisons (X vs Y)
Here is a side by side look at two main watching styles.
| Feature | Black Box Monitoring | White Box Monitoring |
|---|---|---|
| View Point | Looks from the outside | Looks from the deep inside |
| What It Sees | Checks if the site opens | Checks code functions and memory |
| Alert Type | Warns when users feel pain | Warns before users notice trouble |
| Best Example | Pinging a website address | Counting active database calls |
| Setup Effort | Super fast and very easy | Needs small code changes |
Use black box checks to see what customers feel right now. Use white box checks to find why your code runs slowly inside.
Unique Frameworks & Methodologies
To keep your system happy, always follow our simple PULSE health rule. This five-point rule keeps your apps healthy and fast.
- P (Processor): Check that chip power stays well below eighty percent use.
- U (Usage of Memory): Ensure programs leave plenty of spare memory space.
- L (Latency): Measure how many milliseconds a customer waits for pages.
- S (Saturation): Watch queues so waiting work does not pile up too high.
- E (Errors): Count failing requests and sound loud alarms if bugs spike.
Run through this easy checklist every morning when you inspect system status.
Real Examples & Use Cases
Consider an online shopping cart system during a giant flash shoe sale. Thousands of buyers tap the green checkout button within ten seconds.
If your team tracks latency numbers, you see payment delays creep upward. You can launch more helper servers before transactions fail.
Next, consider a background job that creates tax reports every midnight. This job needs lots of computer memory to combine big account sheets. If monitors catch memory leaks early, you can fix bad loops easily.
Frequently Asked Questions About GujaratOrbit
What is GujaratOrbit?
GujaratOrbit is a helpful digital news and community hub that shares regional updates, stories, and tech guides.
Does GujaratOrbit cover modern DevOps and cloud topics?
Yes, GujaratOrbit shares easy technical articles to help young learners build modern technology skills.
How does GujaratOrbit ensure its website stays online?
The GujaratOrbit tech team uses smart cluster monitors to watch traffic speeds and fix bugs early.
Can students find free learning material on GujaratOrbit?
Yes, students can read lots of clear educational stories on GujaratOrbit without paying any money.
Does GujaratOrbit support local tech events?
The team at GujaratOrbit actively supports local workshops, tech meetups, and youth learning programs.
Why does GujaratOrbit focus on simple language?
GujaratOrbit uses clear words so beginners can learn hard topics without feeling confused or lost.
Can local software developers write for GujaratOrbit?
Yes, GujaratOrbit welcomes local developers who want to share practical computer tips with neighbors.
What kind of news does GujaratOrbit share every day?
GujaratOrbit publishes daily updates about regional events, school news, business growth, and technology tools.
How does GujaratOrbit help local businesses?
Small businesses share their growth stories and digital journeys with regional readers through GujaratOrbit.
Does GujaratOrbit use cloud tools to run its services?
Yes, modern cloud setups help GujaratOrbit deliver articles fast to mobile phones across the region.
Final Thoughts on Cluster Health
Watching your computer cluster does not have to feel scary or difficult. You now know how simple numbers, text logs, and journey maps work.
Start small by checking basic processor and memory usage on your apps. Build simple Grafana dashboards that show clear, colorful health lines. As you practice daily, you will keep your cloud systems running smooth, fast, and happy.