Introduction (100–200 words)
Infrastructure monitoring tools help you observe the health and performance of the systems that run your applications—servers, VMs, containers, Kubernetes clusters, networks, databases, and cloud services. In plain English: they tell you what’s up, what’s slow, and what’s about to break—before users notice.
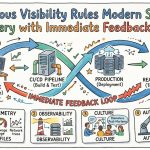
This matters even more in 2026+ because infrastructure is more distributed and dynamic (Kubernetes, edge workloads, multi-cloud), incidents are more expensive (always-on expectations), and teams are leaner (automation and AI-assisted operations are becoming table stakes). Monitoring has also converged with observability: metrics, logs, traces, events, and topology data increasingly need to work together.
Common use cases
- Detecting CPU/memory/disk/network saturation before an outage
- Monitoring Kubernetes nodes/pods, autoscaling behavior, and cluster capacity
- Cloud service health tracking (managed databases, load balancers, queues)
- Proactive anomaly detection (traffic spikes, noisy neighbors, failing hardware)
- SLO/SLA reporting for internal stakeholders or customers
What buyers should evaluate (6–10 criteria)
- Breadth of coverage (hosts, containers, K8s, network, cloud services)
- Data model (metrics/logs/traces/events) and correlation across them
- Alerting quality (noise control, deduplication, routing, on-call workflows)
- Dashboards and custom reporting (SLOs, capacity, cost, compliance)
- Automation/AIOps (anomaly detection, root cause hints, remediation hooks)
- Integrations (cloud providers, CI/CD, ITSM, chat, incident tools)
- Deployment model (SaaS vs self-hosted) and scaling characteristics
- Security features (RBAC, audit logs, encryption, tenant isolation)
- Total cost of ownership (ingestion pricing, retention, operational overhead)
Best for: SRE and platform teams, IT operations, DevOps engineers, and IT managers at companies running production workloads across cloud, hybrid, or on-prem environments—especially SaaS, fintech, e-commerce, healthcare, and enterprises with strict uptime expectations.
Not ideal for: very small projects with a single VM and minimal uptime needs, teams that only need basic host up/down checks, or organizations that can rely solely on a single cloud provider’s built-in metrics. In these cases, lightweight tools or native cloud monitoring may be sufficient.
Key Trends in Infrastructure Monitoring Tools for 2026 and Beyond
- AIOps becomes practical (when fed good data): anomaly detection, alert clustering, incident summarization, and suggested remediation steps are increasingly embedded—but still require disciplined tagging and ownership models.
- OpenTelemetry and standardization pressure: even infrastructure monitoring stacks are adapting to more standardized telemetry pipelines, reducing vendor lock-in (or at least making it easier to run dual vendors during transitions).
- Kubernetes-first monitoring patterns: node-level monitoring is no longer enough; teams need visibility into pods, controllers, CNI networking, service meshes, and cluster autoscaling behavior.
- More “entity-centric” views: tools increasingly model infrastructure as entities (host, pod, service, database) with topology maps and dependency graphs to speed incident triage.
- Security expectations rise: MFA, SSO/SAML, RBAC, audit logs, and encryption are increasingly non-negotiable; buyer scrutiny around access controls and tenant isolation continues to increase.
- FinOps meets monitoring: teams expect capacity planning and cost signals (or at least integration points) so they can connect performance to spend.
- Shift-left monitoring: monitoring configs, dashboards, and alert rules are moving into Git (monitoring-as-code), aligning with IaC and CI/CD.
- More hybrid deployment patterns: even SaaS-first tools must support air-gapped or restricted environments via collectors, private links, or hybrid gateways (capabilities vary).
- Alert fatigue countermeasures: deduplication, dynamic thresholds, SLO-based alerting, and on-call routing rules are standard expectations.
- Data retention and sovereignty choices: customers want more control over retention, region placement, and data lifecycle policies (options vary significantly by vendor).
How We Selected These Tools (Methodology)
- Focused on tools with strong market adoption/mindshare in infrastructure monitoring across cloud and on-prem environments.
- Prioritized feature completeness: host/VM monitoring, container/Kubernetes support, alerting, dashboards, and automation.
- Considered reliability and performance signals such as scalability patterns (high-cardinality metrics, large fleets) and operational maturity.
- Evaluated security posture signals based on publicly described capabilities (RBAC, SSO, audit logs, encryption). Where unclear, marked as “Not publicly stated.”
- Looked for integration breadth: cloud platforms, Kubernetes ecosystems, incident response, ITSM, and APIs/webhooks.
- Included a balanced mix: enterprise suites, developer-first SaaS, and open-source/self-hosted options.
- Favored tools that remain relevant for 2026+: modern Kubernetes/cloud support, AI-assisted workflows, and monitoring-as-code options.
- Considered fit across segments (SMB to enterprise) rather than selecting only premium enterprise platforms.
Top 10 Infrastructure Monitoring Tools
#1 — Datadog
Short description (2–3 lines): A SaaS monitoring platform that unifies infrastructure metrics, logs, and related signals with strong integrations and dashboards. Popular with cloud-native teams and organizations scaling across multi-cloud and Kubernetes.
Key Features
- Host, VM, container, and Kubernetes monitoring with deep tagging and filtering
- Large integration catalog for cloud services, databases, and middleware
- Alerting with routing, on-call integrations, and noise reduction controls
- Unified dashboards, service maps/topology-style views (capabilities vary by module)
- Anomaly detection and automated insights (capabilities vary by plan/module)
- Agent-based and agentless collection options (coverage varies)
- Monitoring-as-code patterns via APIs and configuration tooling (implementation varies)
Pros
- Strong “time-to-value” for teams that want quick visibility across stacks
- Broad ecosystem makes it easier to standardize monitoring across tools/services
- Scales well for dynamic infrastructure with consistent tagging practices
Cons
- Costs can rise with data volume, retention, and multiple modules
- Requires governance (tags, ownership, alert standards) to avoid sprawl
- Some advanced workflows depend on purchasing additional modules
Platforms / Deployment
- Web
- Cloud
Security & Compliance
- RBAC, encryption, audit logs, MFA: Varies by plan / Not publicly stated
- SSO/SAML: Varies by plan / Not publicly stated
- SOC 2 / ISO 27001 / HIPAA / GDPR: Not publicly stated
Integrations & Ecosystem
Datadog is known for a large integration ecosystem across cloud providers, Kubernetes, databases, and incident response tooling, plus APIs for automation.
- AWS, Azure, Google Cloud
- Kubernetes, Docker, Helm-based installs
- Slack, Microsoft Teams (via connectors), PagerDuty, Opsgenie
- Jira, ServiceNow (via integrations/connectors; availability varies)
- Terraform/provider-style automation patterns (implementation varies)
- APIs/webhooks for custom metrics and event ingestion
Support & Community
Strong documentation and onboarding materials; support tiers vary by plan. Community is active with many shared dashboards and integration patterns.
#2 — Dynatrace
Short description (2–3 lines): An enterprise-grade monitoring and observability platform with deep automation and topology awareness. Often chosen by larger organizations that want standardized instrumentation and AI-assisted operations.
Key Features
- Full-stack infrastructure monitoring across hosts, VMs, and containers
- Automatic dependency mapping and entity/topology modeling (capabilities vary)
- Advanced alerting with event correlation and noise reduction
- Kubernetes monitoring with workload and cluster-level visibility
- AI-assisted anomaly detection and incident context (capabilities vary)
- Centralized dashboards and reporting for ops and leadership
- Agent-based collection with broad environment coverage
Pros
- Strong at correlating signals across complex enterprise environments
- Useful for organizations standardizing monitoring across many teams
- Good fit for hybrid environments (on-prem + cloud)
Cons
- Can be complex to roll out at scale without a clear operating model
- Licensing/value can be harder to predict for some environments
- Advanced customization may require platform expertise
Platforms / Deployment
- Web
- Cloud / Hybrid (varies)
Security & Compliance
- RBAC, encryption, audit logs, MFA: Varies by plan / Not publicly stated
- SSO/SAML: Varies / Not publicly stated
- SOC 2 / ISO 27001 / GDPR: Not publicly stated
Integrations & Ecosystem
Dynatrace supports broad enterprise integrations and automation hooks, typically oriented around standardized rollout and IT workflows.
- Kubernetes and major cloud providers
- ITSM and incident tooling integrations (availability varies)
- CI/CD and deployment event annotations (capabilities vary)
- APIs for data ingestion, dashboards, and automation
- Webhooks for alert routing and remediation workflows
Support & Community
Enterprise-grade support offerings are common; documentation is extensive. Community resources exist, though many deployments rely on vendor/partner guidance.
#3 — New Relic
Short description (2–3 lines): A SaaS observability platform that includes strong infrastructure monitoring alongside logs and other telemetry. Often used by product and engineering teams who want a unified view across services and underlying hosts.
Key Features
- Host and infrastructure monitoring with flexible dashboards
- Kubernetes monitoring with cluster and workload visibility (capabilities vary)
- Alerting policies, incident workflows, and notification routing
- Telemetry ingestion options designed for broad data types (varies by setup)
- Query-driven exploration for faster ad-hoc investigations
- Anomaly detection and guided troubleshooting features (varies)
- APIs for automation and monitoring-as-code patterns (varies)
Pros
- Good balance between engineering-friendly workflows and enterprise needs
- Flexible querying helps when you’re diagnosing unknown/novel issues
- Works well when you want a single platform view across environments
Cons
- Requires discipline to standardize naming/tags for long-term usability
- Pricing/value can vary based on ingest and feature mix
- Some teams may find the platform broad and need time to configure it well
Platforms / Deployment
- Web
- Cloud
Security & Compliance
- RBAC, encryption, MFA, audit logs: Varies by plan / Not publicly stated
- SSO/SAML: Varies by plan / Not publicly stated
- SOC 2 / ISO 27001 / HIPAA / GDPR: Not publicly stated
Integrations & Ecosystem
New Relic typically integrates well with cloud platforms, Kubernetes tooling, and incident response stacks, with APIs for extension.
- AWS, Azure, Google Cloud integrations (capabilities vary)
- Kubernetes and container monitoring integrations
- PagerDuty/Opsgenie-style on-call routing (availability varies)
- Slack/Teams notifications (via integrations/connectors; varies)
- Webhooks and APIs for custom events and automation
Support & Community
Documentation is generally strong with many examples; support tiers vary. Community resources exist, especially around dashboards and queries.
#4 — Splunk Observability Cloud
Short description (2–3 lines): A cloud-native observability suite (including infrastructure monitoring) designed for high-volume environments and rapid troubleshooting. Often adopted by enterprises and teams already aligned with Splunk ecosystems.
Key Features
- Infrastructure monitoring with real-time metrics and dashboards
- Alerting and detector-based logic (terminology and capabilities vary)
- Strong correlation workflows across telemetry signals (varies by module)
- Kubernetes monitoring with workload-level insights (varies)
- High-scale metrics handling for large fleets (implementation-dependent)
- Integration patterns for enterprise incident and IT operations
- APIs for automation and extensibility
Pros
- Designed for high-volume monitoring and complex environments
- Fits well in enterprise operational processes and governance models
- Strong for teams wanting consistent workflows across telemetry types
Cons
- Can be costly depending on scale and data volumes
- Some features require careful configuration to avoid alert noise
- Best results often come with experienced admins and clear standards
Platforms / Deployment
- Web
- Cloud
Security & Compliance
- RBAC, encryption, audit logs, MFA: Varies by plan / Not publicly stated
- SSO/SAML: Varies / Not publicly stated
- SOC 2 / ISO 27001 / GDPR: Not publicly stated
Integrations & Ecosystem
Splunk Observability Cloud typically supports integrations with cloud providers, container platforms, and incident/ITSM workflows, plus APIs for custom pipelines.
- AWS/Azure/GCP integrations (varies)
- Kubernetes and container ecosystems
- ITSM and incident response tools (availability varies)
- APIs/webhooks for alerts and data routing
- Automation hooks for remediation runbooks (varies)
Support & Community
Support is typically enterprise-oriented; documentation is extensive. Community strength is meaningful, especially among Splunk-aligned organizations.
#5 — Elastic Observability
Short description (2–3 lines): Observability capabilities built on the Elastic Stack, commonly used for logs plus infrastructure monitoring in the same ecosystem. Attractive for teams that want flexible search, analytics, and deployment control (self-managed or cloud).
Key Features
- Infrastructure metrics and host monitoring (capabilities vary by setup)
- Log-centric workflows with correlation to infrastructure context
- Powerful search and aggregation for incident investigation
- Alerting and detection rules (capabilities vary by licensing/deployment)
- Flexible data pipelines and index lifecycle management options
- Kubernetes and cloud integrations (coverage varies)
- Self-hosted scaling options for organizations with in-house expertise
Pros
- Strong for teams that want logs + metrics in a searchable analytics engine
- Deployment flexibility (self-managed or cloud) fits data control needs
- Highly extensible for custom data and advanced queries
Cons
- Operational overhead can be significant in self-hosted deployments
- Tuning and cost management require experience (indexes, retention, shards)
- Some advanced features depend on licensing and architecture choices
Platforms / Deployment
- Web
- Cloud / Self-hosted / Hybrid
Security & Compliance
- RBAC, encryption, audit logs, SSO options: Varies by plan/deployment / Not publicly stated
- SOC 2 / ISO 27001 / GDPR: Not publicly stated
Integrations & Ecosystem
Elastic supports a broad ecosystem of ingest pipelines, agents/collectors, and integrations, particularly strong for log-heavy environments.
- Cloud provider integrations (varies)
- Kubernetes monitoring and log collection patterns
- SIEM/security workflows overlap (useful in some orgs)
- APIs for ingestion, query, dashboards, and automation
- Webhooks/connectors for alert notifications (varies)
Support & Community
Large open-source community and many deployment guides; support varies widely depending on cloud vs self-managed and purchased support levels.
#6 — Prometheus
Short description (2–3 lines): A widely used open-source metrics monitoring system designed for cloud-native environments. Often paired with Alertmanager (alerts) and Grafana (dashboards), making it a core building block for Kubernetes monitoring stacks.
Key Features
- Pull-based metrics scraping with a time-series database
- Powerful query language for metrics exploration and alert rules
- Kubernetes-native service discovery and label-based metrics modeling
- Alertmanager integration for routing, grouping, and silencing alerts
- Exporter ecosystem for hosts, databases, network devices, and more
- Federation and remote-write patterns (implementation varies)
- Strong fit for “monitoring-as-code” through config management and GitOps
Pros
- Excellent for Kubernetes and cloud-native metrics with flexible labeling
- Strong open ecosystem and portability across environments
- Can be cost-effective if you have the operational maturity to run it well
Cons
- Operating at large scale (high cardinality, long retention) requires expertise
- Dashboards and alert hygiene are “on you” (less turnkey than SaaS)
- Long-term storage typically needs additional components (varies by architecture)
Platforms / Deployment
- Linux
- Self-hosted
Security & Compliance
- Security features depend on how you deploy it (reverse proxy, auth, network policies): Varies / N/A
- SOC 2 / ISO 27001 / HIPAA: N/A (open-source project)
Integrations & Ecosystem
Prometheus has a large ecosystem of exporters and integrations, and it’s frequently embedded into Kubernetes platforms and managed monitoring offerings.
- Kubernetes service discovery
- Exporters (node, database, message queues, web servers, etc.)
- Grafana for visualization (common pairing)
- Alertmanager for alert routing and silences
- Remote storage integrations (varies by chosen backend)
- APIs for querying and automation
Support & Community
Very strong open-source community and extensive documentation. Commercial support depends on third-party vendors or internal expertise.
#7 — Zabbix
Short description (2–3 lines): A mature open-source monitoring platform popular for traditional infrastructure (servers, networks, SNMP devices) with dashboards and alerting. Often chosen by IT ops teams that want a self-hosted, all-in-one monitoring solution.
Key Features
- Agent and agentless monitoring (including SNMP support)
- Templates for common infrastructure devices and services
- Alerting with escalation rules and notification routing
- Dashboards, maps, and reporting (capabilities vary by version)
- Auto-discovery for hosts and services (implementation varies)
- Proxy architecture for distributed monitoring across sites
- Good fit for mixed environments (on-prem + some cloud)
Pros
- Strong coverage for network and classic IT infrastructure monitoring
- Self-hosted control with mature alerting and discovery features
- Cost-effective for large environments if you can run it internally
Cons
- UI and configuration model can feel complex at first
- Scaling and performance require careful sizing and database tuning
- Cloud-native/Kubernetes experiences may be less native than newer stacks
Platforms / Deployment
- Web
- Self-hosted
Security & Compliance
- RBAC and encryption options: Varies by configuration / Not publicly stated
- SOC 2 / ISO 27001: N/A (open-source project)
Integrations & Ecosystem
Zabbix integrates through templates, APIs, and common notification and automation mechanisms.
- SNMP-based device monitoring
- Scripts and webhooks for notifications
- APIs for provisioning and automation
- Integration patterns for ticketing/on-call tools (varies)
- Community templates for many devices and services
Support & Community
Strong community and documentation; commercial support and training are available (details vary by provider/region).
#8 — Nagios (Core / XI)
Short description (2–3 lines): A long-standing monitoring solution best known for host/service checks and plugin-based extensibility. Common in traditional IT environments where teams value simple up/down checks and a large legacy plugin ecosystem.
Key Features
- Plugin-based checks for hosts, services, and network devices
- Flexible alerting and notification rules (configuration-driven)
- Scheduled checks with state tracking and acknowledgements
- Large ecosystem of community plugins (quality varies)
- Works well for basic availability monitoring and NOC-style workflows
- Can be extended with add-ons for dashboards and reporting (varies)
- Suitable for environments with many legacy systems
Pros
- Proven model for availability monitoring with a huge plugin ecosystem
- Highly customizable for specific checks and legacy needs
- Useful as a lightweight “last line” monitor for critical endpoints
Cons
- Less modern UX and cloud-native ergonomics compared to newer tools
- Scaling and configuration management can become burdensome
- Correlation and topology-aware troubleshooting are limited without add-ons
Platforms / Deployment
- Linux
- Self-hosted
Security & Compliance
- Security depends heavily on deployment hardening and access controls: Varies / N/A
- SOC 2 / ISO 27001: N/A / Not publicly stated
Integrations & Ecosystem
Nagios integration is primarily driven by plugins and scripts; it works well when you need custom checks.
- Plugin ecosystem for services and protocols
- SNMP checks via plugins (common)
- Email/SMS/chat notifications via scripts/connectors (varies)
- APIs/add-ons depending on edition and extensions (varies)
Support & Community
Community for Nagios Core is large with many plugins and guides. Commercial support varies by edition (Core vs XI) and chosen support package.
#9 — Checkmk
Short description (2–3 lines): An infrastructure monitoring platform known for strong host/service monitoring and auto-discovery, often used by IT operations teams managing mixed estates (servers, network devices, applications). Available in open-source and commercial editions (feature sets vary).
Key Features
- Auto-discovery and inventory for hosts and services (key strength)
- Agent-based monitoring with efficient check execution
- Dashboards and views designed for NOC and ops workflows
- Rule-based alerting and notification mechanisms
- Support for monitoring network devices and classic infrastructure
- Distributed monitoring via sites for scalability (varies)
- Extensible checks and integrations (varies by edition)
Pros
- Fast to roll out for broad infrastructure coverage due to discovery features
- Strong fit for network + server monitoring in hybrid environments
- Good operational ergonomics for IT ops teams
Cons
- Advanced features and scalability options may depend on edition
- Less “Kubernetes-native” than Prometheus-first stacks for some use cases
- Customization can require learning the platform’s rule model
Platforms / Deployment
- Linux
- Self-hosted
Security & Compliance
- RBAC and security features: Varies by edition/configuration / Not publicly stated
- SOC 2 / ISO 27001: Not publicly stated
Integrations & Ecosystem
Checkmk integrates through built-in connectors, APIs, and alerting hooks; it’s commonly used alongside ITSM and on-call tooling.
- SNMP and network device monitoring
- APIs for automation and provisioning (availability varies)
- Notifications to on-call/incident tools (varies)
- Integration with ticketing/ITSM systems (varies)
- Custom checks/plugins for specialized services
Support & Community
Documentation is generally solid; community is active. Commercial support and SLAs vary by edition and vendor agreement.
#10 — SolarWinds Observability (and SolarWinds Platform modules)
Short description (2–3 lines): A suite of infrastructure and network monitoring products commonly used by IT operations teams, especially in environments with significant on-prem networking and server footprints. Often selected for NOC-style monitoring and network visibility.
Key Features
- Network and infrastructure monitoring for servers, devices, and interfaces
- Dashboards and reporting suited for operational teams
- Alerting with thresholds, dependencies, and routing (varies by module)
- Discovery features for mapping devices and relationships (varies)
- Performance monitoring across network paths and device metrics (varies)
- Integrations and APIs for operational workflows (varies)
- Options spanning on-prem and SaaS offerings (availability varies)
Pros
- Strong fit for organizations prioritizing network device visibility
- Useful for centralized IT operations and NOC workflows
- Broad module ecosystem for different infrastructure domains
Cons
- Complexity can increase with multiple modules and scaling requirements
- Modern cloud-native/Kubernetes depth may be less central than network-centric tools
- Operational overhead and licensing structure can be non-trivial
Platforms / Deployment
- Web / Windows (varies by module)
- Cloud / Self-hosted / Hybrid (varies)
Security & Compliance
- RBAC, audit logs, encryption, SSO options: Varies by product/module / Not publicly stated
- SOC 2 / ISO 27001 / GDPR: Not publicly stated
Integrations & Ecosystem
SolarWinds ecosystems often integrate with IT operations tooling and network management workflows, with extensibility depending on modules.
- Network device monitoring integrations (SNMP, NetFlow-style tooling; varies)
- ITSM and ticketing integrations (varies)
- Alert notifications to chat/on-call tools (varies)
- APIs/SDKs (availability varies by product)
- Role-based operational workflows across modules
Support & Community
Support and onboarding vary by product and contract. Community resources exist, especially among network and IT operations professionals.
Comparison Table (Top 10)
| Tool Name | Best For | Platform(s) Supported | Deployment (Cloud/Self-hosted/Hybrid) | Standout Feature | Public Rating |
|---|---|---|---|---|---|
| Datadog | Cloud-native teams needing fast, broad coverage | Web | Cloud | Huge integration ecosystem + unified monitoring workflows | N/A |
| Dynatrace | Enterprises needing automation and topology-aware monitoring | Web | Cloud / Hybrid (varies) | Automated dependency mapping and AI-assisted triage (varies) | N/A |
| New Relic | Engineering teams wanting flexible, query-driven investigations | Web | Cloud | Flexible exploration and telemetry-driven workflows | N/A |
| Splunk Observability Cloud | High-volume enterprise monitoring and correlation workflows | Web | Cloud | Designed for high-scale metrics and enterprise operations | N/A |
| Elastic Observability | Teams wanting logs + metrics in a searchable analytics engine | Web | Cloud / Self-hosted / Hybrid | Powerful search/analytics and deployment flexibility | N/A |
| Prometheus | Kubernetes-first metrics monitoring and monitoring-as-code | Linux | Self-hosted | Label-based metrics + exporter ecosystem | N/A |
| Zabbix | Traditional infrastructure and network monitoring (self-hosted) | Web | Self-hosted | Templates + SNMP + distributed proxies | N/A |
| Nagios (Core/XI) | Basic availability monitoring with plugin extensibility | Linux | Self-hosted | Huge plugin ecosystem for legacy checks | N/A |
| Checkmk | Ops teams needing fast discovery and broad infra coverage | Linux | Self-hosted | Auto-discovery and inventory-led monitoring | N/A |
| SolarWinds Observability | Network-centric IT monitoring and NOC operations | Web / Windows (varies) | Cloud / Self-hosted / Hybrid (varies) | Strong network device visibility (varies by module) | N/A |
Evaluation & Scoring of Infrastructure Monitoring Tools
Scoring model (1–10): Higher is better. Scores are comparative and based on typical real-world fit, not a guarantee for every environment.
Weights:
- Core features – 25%
- Ease of use – 15%
- Integrations & ecosystem – 15%
- Security & compliance – 10%
- Performance & reliability – 10%
- Support & community – 10%
- Price / value – 15%
| Tool Name | Core (25%) | Ease (15%) | Integrations (15%) | Security (10%) | Performance (10%) | Support (10%) | Value (15%) | Weighted Total (0–10) |
|---|---|---|---|---|---|---|---|---|
| Datadog | 9 | 8 | 10 | 8 | 9 | 8 | 7 | 8.5 |
| Dynatrace | 9 | 7 | 8 | 8 | 9 | 8 | 6 | 7.9 |
| New Relic | 8 | 8 | 8 | 8 | 8 | 7 | 7 | 7.8 |
| Splunk Observability Cloud | 8 | 7 | 8 | 8 | 8 | 8 | 6 | 7.6 |
| Elastic Observability | 8 | 6 | 7 | 7 | 8 | 7 | 8 | 7.4 |
| Prometheus | 7 | 5 | 8 | 6 | 8 | 8 | 9 | 7.3 |
| Zabbix | 7 | 6 | 6 | 7 | 7 | 7 | 9 | 7.0 |
| Checkmk | 7 | 7 | 6 | 7 | 7 | 7 | 8 | 7.0 |
| SolarWinds Observability | 7 | 7 | 6 | 7 | 7 | 7 | 6 | 6.7 |
| Nagios (Core/XI) | 6 | 4 | 6 | 6 | 7 | 7 | 8 | 6.2 |
How to interpret these scores
- Treat them as a shortlisting aid, not a definitive ranking for every organization.
- A 0.5–1.0 difference is meaningful when tools are close; validate with a pilot.
- “Value” varies the most by data volume, retention, and team time (especially for self-hosted).
- Your best choice often depends on deployment constraints (air-gapped, hybrid), Kubernetes maturity, and integration requirements.
Which Infrastructure Monitoring Tool Is Right for You?
Solo / Freelancer
If you run a few services and want basic visibility:
- Prometheus can work well if you’re comfortable operating it and want low software costs.
- Zabbix or Checkmk are strong if you’re monitoring a mix of servers and network devices and prefer a self-hosted all-in-one tool.
- If you want minimal setup overhead and can justify SaaS spend, Datadog or New Relic can be efficient—just keep an eye on data volumes.
SMB
For SMBs, the decision is often about speed vs control:
- Choose Datadog or New Relic if you want faster onboarding, lots of integrations, and standardized dashboards/alerts across a growing stack.
- Choose Checkmk or Zabbix if you have an IT ops team comfortable running monitoring internally and need strong network/server monitoring without SaaS constraints.
- If you’re Kubernetes-heavy, Prometheus (with a well-defined dashboard/alert approach) is still a common default.
Mid-Market
Mid-market organizations typically need cross-team standardization without enterprise overhead:
- Datadog is often a good fit when multiple teams need consistent tagging, dashboards, and alert routing.
- New Relic works well when engineering teams value query-driven analysis and flexible instrumentation approaches.
- Elastic Observability is strong if logs/search are central and you want infrastructure visibility in the same analytics platform.
- Splunk Observability Cloud can be compelling when you’re scaling telemetry and want enterprise operational workflows.
Enterprise
Enterprises usually optimize for governance, security controls, and incident throughput:
- Dynatrace is frequently considered for its automation and topology-aware troubleshooting patterns (capabilities vary).
- Splunk Observability Cloud can fit well in environments that already align to Splunk-style operational models.
- Datadog is also common in large enterprises—especially where cloud-native adoption is high and integration breadth matters.
- SolarWinds Observability remains relevant in network-centric enterprises with established NOC practices and on-prem device monitoring needs.
Budget vs Premium
- Budget-conscious / self-hosted: Prometheus, Zabbix, Nagios, Checkmk (but budget for people-time and operational overhead).
- Premium / faster time-to-value: Datadog, Dynatrace, New Relic, Splunk Observability Cloud (budget for data volume and module sprawl).
Feature Depth vs Ease of Use
- If you want deep, automated context and can invest in rollout: Dynatrace, Splunk Observability Cloud.
- If you want broad features with relatively fast adoption: Datadog, New Relic.
- If you want simple availability monitoring: Nagios (especially for legacy checks).
- If you want maximum control and customization: Prometheus, Elastic Observability (especially self-hosted).
Integrations & Scalability
- For broad integrations: Datadog is a common benchmark; New Relic and Splunk also cover many ecosystems.
- For Kubernetes scale: Prometheus is proven, but you must design for cardinality, retention, and remote storage.
- For traditional infra scale across sites: Zabbix proxies and Checkmk distributed setups can work well.
Security & Compliance Needs
- If you require SSO/SAML, audit logs, strict RBAC, and enterprise governance, confirm which features are included in your plan (SaaS tools vary).
- For regulated environments with data residency constraints, evaluate deployment options (Elastic self-hosted, Prometheus, Zabbix, Checkmk) or vendor regional offerings (varies).
Frequently Asked Questions (FAQs)
What’s the difference between infrastructure monitoring and observability?
Infrastructure monitoring focuses on the health/performance of infrastructure components (hosts, networks, containers). Observability typically includes infrastructure plus logs/traces and correlation to understand why something happened.
Do I need Kubernetes monitoring if I already monitor hosts?
Usually yes. Host metrics won’t tell you enough about pod scheduling, container restarts, resource limits, or cluster autoscaling. Kubernetes adds its own failure modes and capacity constraints.
How do these tools typically charge for pricing?
Pricing models vary: per host, per container, per metric/event, and/or by data ingestion and retention. Many vendors bundle capabilities into modules; overall cost depends heavily on telemetry volume.
How long does implementation usually take?
A basic rollout can take days; a well-governed rollout across teams often takes weeks to months. Tagging standards, alert rules, ownership, and dashboard conventions drive most of the timeline.
What’s the most common mistake when setting up monitoring?
Alerting on raw thresholds without context, which creates noise. Better patterns include SLO-based alerts, dynamic thresholds, deduplication, and routing by service ownership.
Are AI features reliable enough to trust for incidents?
They can help, especially for alert clustering and anomaly detection, but they’re not magic. AI works best with clean tagging, consistent instrumentation, and well-defined services and dependencies.
Should I choose a SaaS tool or self-hosted?
SaaS reduces operational overhead and speeds adoption; self-hosted increases control and can reduce software cost but requires staffing for scaling, upgrades, and reliability.
How do I evaluate security for monitoring tools?
Look for RBAC granularity, SSO/SAML support, MFA, audit logs, encryption, and tenant/project separation. Also confirm data retention controls and access logging for incident investigations.
Can I run two monitoring tools at once during migration?
Yes, and it’s common. Use a phased approach: dual-ingest critical metrics, validate alert parity, and migrate dashboards/service-by-service to avoid blind spots.
What integrations matter most for real-world operations?
At minimum: cloud provider integrations, Kubernetes, an incident/on-call tool, and chat/notifications. For larger orgs, ITSM and CMDB integrations can matter for governance and reporting.
What are alternatives if I only need basic “up/down” checks?
For simple availability monitoring, tools like Nagios or lightweight checks and native cloud monitoring can be enough. The more dynamic your environment, the more you’ll benefit from richer telemetry and correlation.
Conclusion
Infrastructure monitoring tools are no longer just about “CPU is high.” In 2026+, they’re about running reliable systems in distributed environments—Kubernetes, multi-cloud, hybrid networks—while keeping alert noise manageable and security controls tight.
- If you want broad coverage and rapid adoption, SaaS platforms (Datadog, New Relic, Dynatrace, Splunk Observability Cloud) tend to win on time-to-value.
- If you need deployment control or have strong in-house ops expertise, self-hosted stacks (Prometheus, Elastic, Zabbix, Checkmk, Nagios) can be powerful and cost-effective—if you invest in operating them well.
- The “best” tool depends on your environment, team structure, data volumes, and governance requirements.
Next step: shortlist 2–3 tools, run a 2–4 week pilot on one production-like service, and validate integrations, alert quality, access controls, and total cost at your expected telemetry volume.


Leave a Reply
You must be logged in to post a comment.